Thursday, November 20, 2014

Catalase enzyme

The purpose of this lab was to measure the rate of the reaction from the catalase enzyme and hydrogen peroxide from the number of enzymes we used to speed up the reaction. Because enzymes are things that speed up reactions, we test the use of it by using hydrogen peroxide. The formula is 2*H2O2-> 2h2O +O2. This means changing hydrogen peroxide to water and oxygen. So we're testing how much oxygen gets released in the limited amount of time.

We hypothesize that the more enzymes we put into the solution the faster the reaction will be and the more time passes by, the reaction rate will slow down, so in the beginning it will react fastest and after it will slow.

Here is our procedure and materials.

Materials: (per team of 2) 2 pairs safety goggles

2 lab aprons

50 mL beaker

10 mL and 50 mL graduated cylinder Test tubes

Fresh 3% H2O2

forceps                   

Water pan

Test tube rack Catalase solution               

Thermometer

Filter Paper

Paper punches

Catalase

Reaction chambers (Drosophila vials with 1- hole stoppers                   

Stop watch Ice                   

Also needed to prep lab: liver, cheesecloth, blender


Procedure:

1. Prepare a table in your data book similar to Table 1.

2. Obtain a small amount of stock catalase solution in a 50-ml beaker


3. Obtain a reaction chamber and a number of filter-paper disks.

4. Place four catalase-soaked filter paper disks high on one interior sidewall of the reaction chamber. (They will stick to the sidewall.) Prepare a disk for use in the reaction chamber by holding it by its edge with a pair of forceps and dipping it into the stock catalase solution for a few seconds. Drain the disk against the sidewall of the beaker before you transfer it to the reaction chamber. CAUTION: Forceps are sharp. Handle with care.


5.Stand the reaction chamber upright and carefully add 10 mL of 3% hydrogen peroxide solution. Do not allow the peroxide to touch the filter paper disks.

6. Tightly stopper the chamber.

7. Fill a pan almost full with water.


8.Lay the 50-mL graduated cylinder on its side in the pan so that it fills with water completely. If any air bubbles are present, carefully work these out by tilting the cylinder slightly while keeping it underwater. Turn the cylinder upside down into an upright position keeping its mouth underwater at all times.

9.Carefully place the reaction chamber and its contents on its side in the pan of water. Make certain that the side with the disks faces upward.                           

10. Move the graduated cylinder into a position so that its mouth comes to lie directly over the tip of the dropping pipet. One member of the team should hold it in this position for the duration of the experiment.                   

11. Rotate the reaction chamber 180o on its side so that the hydrogen peroxide solution comes into contact with the catalase-soaked disks.                   


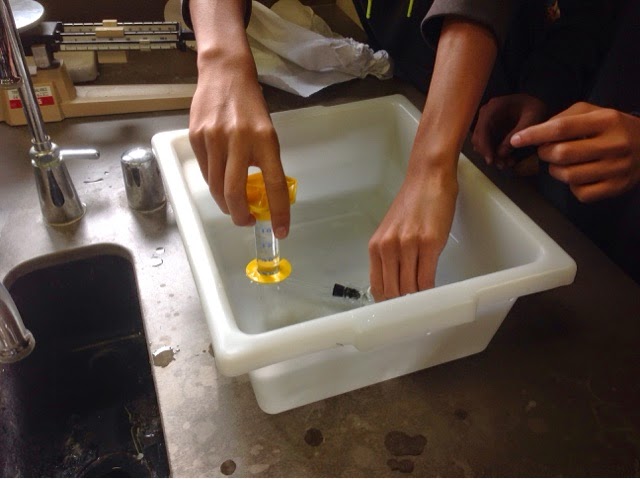
12. Measure the gas levels in the graduated cylinder at 30-second intervals for 10-now 5 minutes. Record the levels in your data table.

Here are our results:


And here is the graph:

After we finished the experiment, we concluded the following results: The first thirty seconds, there is a big increase of rate of reaction, after which it slowed down. After 5 minutes, it sometimes slowed down the reaction, but the differences were very minute. Therefore, i believe that if we had an hour more so we could have gone with the whole experiment instead of cutting it in half, there would have been much more significant differences. The greater amount of dots, the faster the rate of the reaction, however, three and 4 dots were about the same rate, so we would like to try having more dots to confirm this limit(maybe).

Analysis:

  1. We have drawn the graph in our results.

As the time progresses, the rate of the enzymatic reaction goes down a little bit. Although the differences are subtle, the graph of 4 dots showed that in the first thirty seconds it bursts at 2.5 ml of oxygen but then it only went one more milliliter in the next, and then it started being stagnant at the rate of about 0.5 ml per second. Because of this, we should test it with ten minutes to detect the later changes toward the end. For all we know, it could stop by ten minutes.

2. (Graph is above)

The enzyme activity tends to be more as concentration increases which makes the reaction faster. My graph shows that as we increased the number of dots in the reaction, the rate of the reaction and amount of oxygen produced increased. For example, with 1 dot it ends at 2.7 ml while 2 dots ends at 6.4 ml. Three and four dots both ended at 7 ml though, so we should test more to see if there is a maximum amount of enzymes that can be active at one time. We should try more than four dots and also more time because at the end, 3 dots slowed down a little.

3,4,5. We did not do part b and c

Tuesday, November 11, 2014

Relative time

In many sources, we have seen space-time curvature, such as Palkia and Dialga in Pokemon, Kronos in Percy Jackson, and the like. But of course, the most understandable and reasonable one is without a doubt Interstellar. Relativity is the curve of space-time around gravity. That of course is the general relativity. There is also special relativity, but that has almost nothing to do with the movie, so let's just discuss the topic of general relativity. General relativity is the combination of special type and Newton's law of universal gravitation, and it provides a way we can see gravity and space-time using geometric solutions. The most important part of this is the black hole, which is a mass of pure gravitational force, in other words, just a big chunk of mass compressed into a small space. Even though it has mass, it still has the same gravitational force, so even if the sun was a black hole, the planets would still revolve around it, but it would be the size of a basketball. Considering that, since a smallest actual black hole is many thousands of times bigger than the sun, the gravitational force would be so strong that it could bend space-time curvature. For example, the curvature of the solar system would be small.

 However, the space time curvature of the black hole is so strong that it looks something like a vortex:

And that central point, my friends, is the singularity.  As soon as you step into the curve, time slows as you get closer to the center. Finally, at a point call the event horizon, you will be lost forever. Not that you will actually be lost, but you will be moving so slow, that everything around you will be lost to time. In the movie, they showed that even though Cooper and Amelia had only been on Miller's planet for a few hours, their companion on board the Endurance had aged 24 years and 2 months because the planet was so close to the black hole. Also on that planet Miller had simply been killed minutes before they arrived, but they had been getting signals from him for decades because of the time-space interference of the Gargantua. Also in the movie, it showed that he aged slower in the black hole as about 60 years had passed since he entered it. One question I have about this question of general relativity in the movie is that he only aged 60 years after crossing the event horizon, considering that he spent at least a minute in there, shouldn't it have been around a few billion years? It may have been caused because he traveled back in time during his interaction with the 5 dimensional beings, but wouldn't he have to be there before the creation of Gargantua for the time he takes to get out of the black hole(since it is also dilated making it a few billion years)and near Saturn? Also we discussed spaghettification. His future self may have saved him, but the ship should have been destroyed by pulling apart, not by getting hit by numerous beams of light particles, and wouldn't it have been too late for him to not get spagghetified?

Anyway, it was a great movie that gave me lots of ideas and question. GO BELLS!


Monday, November 3, 2014

Dyalisis Diffusion

The purpose of this lab was to recreate and observe diffusion using goat intestin...*ahem* dialysis tubing and the substances that move in and out of the membrane of the cell . We filled a dialysis tube with a starch solution and dunked it into a solution that we dyed orange.


We redid this whole experiment with glucose instead of starch. After 20 minutes, we pulled the first dialysis tube out of the colored water and saw that the color of the startch solution in the tube had changed to blueish black color. Then we dipped an rapidly inflating(5000x inflation) glucose test strip that Mr. Wong bought for 10/3 of a dollar for each strip into the glucose solution beaker and discovered that it had changed to a different color than before.


We used two beakers, iodine and dropping pipette, dialysis tubing, Glucose test strips, distilled water, a starch solution, and a glucose solution.


Twist one end of a piece of dialysis tubing. Fold the twisted end over, and tie it tightly with a piece of string. Prepare the other piece the same way.


Pour soluble -starch solution to within 4 cm the top of one piece of tubing. Twist and tie the end as in step 1. Rinse the tubing under running water to remove any starch fro the outside. 


Place the tubing in a cup of water labeled A. Pour enough Lugol’s iodine solution to give the water a distinct yellowish color. 


Repeat step 2 with the second piece of dialysis tubing, using glucose solution instead of the soluble starch. Place this tubing in a beaker of water labeled B.


Allow the pieces of tubing to stand for about 20 minutes. Dip a glucose test strip into the water in beaker B. Record the color on the strip.


Observe the tubing in beakerA. Record any changes, including color, that you see in either the tubing or the water in the beaker.


Let beakers A and B stand overnight.Record any changes observed the next day. 


In the starch experiment, the iodine molecules from the in beaker A moved to the starch solution inside, turning the starch solution blue. This is because of osmosis, which allows it to travel from greater concentration to smaller concentration. In the glucose experiment, the glucose molecules moved from the inside to the outside as we tested using the glucose test strip that proved that the concentration outside was greater than before. We did not stay overnight and therefore, I cannot answer analysis 3. The starch molecules couldn't pass through because it was too large. If the iodine molecules are small, and the glucose molecules are smaller than starch, both of these molecules would have been able to diffuse. The structure probably contains pores which allow for the diffusion.


In conclusion, I learned that membranes are very complex structures and they can let small molecules like water and iodine in and also,glucose but not big molecules like starch.

Monday, October 27, 2014

Compound Microscope Lab

For this experiment, we wanted to see things that cannot be seen with the naked eye, namely, things that are smaller than 0.1 millimeters. The image differs from what we see with our normal vision because, first, it can display things that we never seen before, and second, it reflects the item shown across the y axis, or, in a more casual sense, horizontally. When we look at it normally, we can usually capture the entire image because we see the whole surrounding. But when we look through the microscope, not all of the object may be in focus because as the resolution gets bigger, the field of view becomes smaller, therefore excluding parts of it. This is because the magnification and the field of view is inversely proportional, and in mathematical terms, magnification*field of view= a set number. The diameter of the low powered view is 500 micrometers. Through microscopes, the normal things become really creepy, like Mario's hair over here:
Here are our steps:
Cut a lower case o from a piece of newspaper. Place it right side up on a clean slide. With a dropping pipette, place one drop of water on the letter. This type of slide is called a wet mount. 
Wait until the paper is soaked before adding a coverslip. Hold the coverslip at about a 45% angle to the slide, and slowly lower it.
Place the slide on the microscope stage, and clamp it down. Move the slide so the letter is in the middle of the hole in the stage. Use the coarse-adjustment knob to lower the low-power objective to the lowest position.
Look through the eyepiece, and use the coarse- adjustment knob to raise the objective slowly until the letter o is in view. Use the fine- adjustment knob to sharpen the focus. Position the diaphragm for the best light. Compare the way the letter looks through the microscope with the way it looks to the naked eye.
To determine how greatly magnified the view is, multiply the number inscribed on the eyepiece by the number on the objective being used.
Follow the same procedure with a lowercase c. In your logbook, describe how the letter looks when viewed through a microscope.
Make a wet mount of the letter e or the letter r. Describe how the letter looks when viewed through the microscope. What new information (not revealed by the letter c) is revealed by the e or r?

Look through the eyepiece at the letter as you use your thumbs and forefingers to move the slide away from you. Which way does your view of the letter move? Move the slide to the right. In which direction does the image move?
Make a pencil sketch of the letter as you see it under the microscope. Label the changes in image and movement that occur under the microscope.
Make a wet mount of two different-colored hairs, one light and one dark. Cross one hair over the other. Position the slide so that the hairs cross in the center of the field. Sketch the hairs under low power; then go to Part D.
With the crossed hairs centered under low power, adjust the diaphragm for the best light.
Turn the high-power objective into viewing position. Do not change the focus.
Sharpen the focus with the fine-adjustment knob only. Do not focus under high power with the coarse-adjustment knob.
 Readjust the diaphragm to get the best light. If you are not successful in finding the object under high power the first time, return to step 20 and repeat the whole procedure carefully.
Using the fine-adjustment knob, focus on the hairs at the point where they cross. Can you see both hairs sharply at the same focus level? How can you use the fine-adjustment knob to determine which hair crosses over the other? Sketch the hairs under high power.
Remove the wet mount of the hairs, and replace it with the prepared slide of the colored threads. The prepared slide contains three colored threads that overlap in a specific order.
Focus the threads under low power, and adjust the diaphragm for best light.
Turn the high-power objective into viewing position. Do not change the focus.
Sharpen the focus with the fine-adjustment knob only.
Readjust the diaphragm to get the best light. If you are not successful in finding the threads under high power, repeat the procedure.
Using the fine-adjustment knob, focus on an area where the threads overlap. Use the fine- adjustment knob to determine the order in which the colored threads lie on the slide.
We deduced that the order of the overlapping threads were first green under everything, then red and black. Since red and black do not intersect in our picture, we could not determine which one was above the other, but we know that green is on the bottom.
The diameter of the high powered view is very small. Calculating it is:
400/40=A so A is 10. Then divide 500 by A to get 50 micrometers. Unfortunately, 400x magnification was ridiculously small that we could barely see anything, Si we did not use it in the pictures. Rather 40 x is sufficient, as a human hair is about 100 micrometers, roughly 0.1 mm, just in or below our sight range.
Through this experiment I learned how to care for microscopes, and how to use it and its specific parts. It also taught me that a in the microscopic world, something little can go a long way through light refraction.

Saturday, October 18, 2014

Strawberry DNA Extraction lab


The purpose of the experiment is to extract the DNA from the strawberries by mashing them after putting them in a plastic bag with an extraction buffer. Some of our key findings were the the white gooey substance on top after the procedure. The significance of this experiment is to know how to extract the DNA from the strawberries and to find out which part of the solution is the DNA. Our major conclusions were that the white substance on top was the DNA.

The problem is that we are trying to find the DNA in strawberries. It was carried out because we had all the materials in hand and we should know what the DNA in strawberries look like. DNA all started with the Swiss physician Friedrich Miescher, who discovered it in 1869 and has left humanity wondering about it for generations after. The general method to approach it is to mash it and use an extraction buffer, which we are doing now. The expected results are that the DNA will float on top and be isolated from the strawberry by the alcohol.

The materials are: zip lock plastic bag, 1 strawberry, 10ml DNA extraction buffer, 2” x 2” cheesecloth (gauze) square funnel, ice cold alcohol, plastic transfer pipette, test tube, and wooden splint .
This experiment consists of the following steps:
1. add 5 ml of liquid dish washing detergent to a 100 ml beaker
2. now, add 0.75 g of salt to the same beaker
3. finally, add 45 ml of distilled water
4. rinse the strawberry with water from the tap and remove anything green (i.e. the stem and sepals
5. place the rinsed strawberry into a zip lock plastic bag and add 10 ml of the extraction buffer. carefully squeeze and seal the bag tightly, making sure any air does not remain in the bag
6. with your fingers, carefully crush or mash the strawberry against the lab table for about 1 minute 
7. place the funnel lined with the cheesecloth (gauze) square into the test tube
8. carefully pour the contents of the plastic bag (i.e. the mashed up strawberry and
extraction buffer mixture) into the gauze and filter the mixture into the test tube through the gauze

9. Fill the test tube with this mixture until it is about 1/4 filled

10. layer an equal volume of ice cold alcohol on top of the strawberry solution in the test tube using the plastic transport pipette
11. observe what happens at the interface of the alcohol and strawberry solution when you twirl a long wooden splint through the interface. keep the tube at eye level and DO NOT SHAKE it. 


In our results, we found the DNA. It is the white substance on top of the alcohol.
In the second picture as follows, we show the DNA rising from the strawberry.

Monday, September 29, 2014

ph lab

:The purpose of this experiment is to determine the specific ph represented by the various colors.Our key finding in this experiment is that as the ph grew higher or lower depending on if we either added bases or acids, respectively, it took more drops of the base or acid to change the ph of the whole solution because the concentration in the hydrogen ions grew larger or smaller depending on the material that we had put in, therefore the rate of change became slower as it progressed. The significance of this experiment is that we can relate the ph to the color after this experiment has concluded. Our major conclusion is that as the ph grew lower, the purple from the cabbage juice grew red and it got brighter as we added more drops, and as the ph grew higher, it turned dark purple, then bluish green, then yellow.
The problem is that we didn’t know that color is associated to ph, as when mr. Wong questioned everyone in the class, not one person mentioned it. When he told us we were pretty surprised because we thought that litmus paper was a special substance and that nothing else could change color when the ph was changed. It was carried out because we wanted to test whether the fact mr. Wong told us was true or not. Red cabbage juice contains anthocyanin pigment flavin, which is like a ph strip. So therefore we added bases and acids to the solution to test if it works. We expected it to change color because our teacher hinted at it, and if it didn't change color then this experiment would have been completely and utterly pointless.
We first took 100 ml of red cabbage juice, put it into a 250 ml beaker, and plunged the ph probe in. Then we took 5 ml of it and put it into a test tube. Then we kept on dripping the acid until it reached 3.4, then 2.4, then we tried to get to 1.4 but we couldn’t. Along each mark we marked the number of drops it took to get there, and we took 5 ml of the solution. Then we retried the experiment only with bases instead of acids, and got new red cabbage juice, and repeated the same thing with base except with marks at 5.4, 6.4, and 7.4. After, we recorded our results and graphed them on a plot chart.
The results and the graphs are as follows
:
This is our picture of the results that we got after conducting the experiment. Because the yellow took to many drops, we couldn't count all of it so we could only display. The 5 the from the right is the original, and everything to the left is acid, and everything to the right is base.
In the acids, it took 7 drops to make the ph 3.4, 24 to make it 2.4, and we stopped after we reached 100 drops where it was 1.8.

This is the graph of the acids. It drops faster in the beginning but slows at the end.


This is the graph of the base. This shows that after 3 drops, the ph became 5.4, then after 5 more drops it became 6.4, and after 11 more drops, it became 7.4. This rate of change in ph is a lot faster than the acid change. That is because the solvent put into the solute has a higher difference in hydrogen atoms, so the average goes up quicker.

This is the graph of how it progressed. It looks remarkably like the square root function in math.

Through this activity, I have learned that ph changes color in various substances, not just litmus paper. I have also learned that as the ph gets higher or lower, the concentration of one drop of the solution will not change the ph of the cabbage juice much because the concentration of the hydrogen ions are getting closer the value of the substance that was originally added to the red cabbage juice.