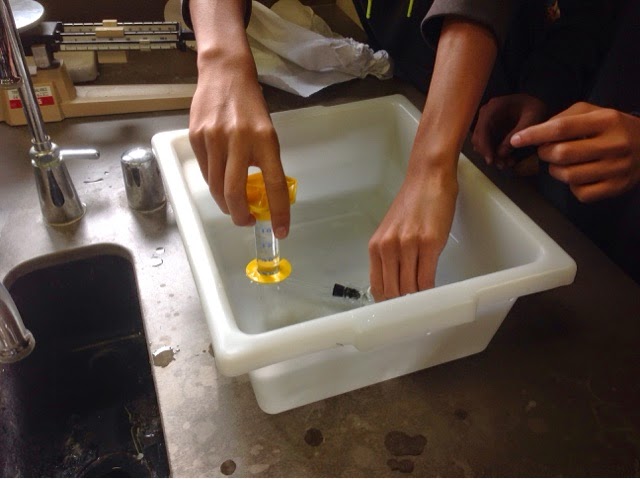
The purpose of this lab was to measure the rate of the reaction from the catalase enzyme and hydrogen peroxide from the number of enzymes we used to speed up the reaction. Because enzymes are things that speed up reactions, we test the use of it by using hydrogen peroxide. The formula is 2*H2O2-> 2h2O +O2. This means changing hydrogen peroxide to water and oxygen. So we're testing how much oxygen gets released in the limited amount of time.
We hypothesize that the more enzymes we put into the solution the faster the reaction will be and the more time passes by, the reaction rate will slow down, so in the beginning it will react fastest and after it will slow.
Here is our procedure and materials.
Materials: (per team of 2) 2 pairs safety goggles
2 lab aprons
50 mL beaker
10 mL and 50 mL graduated cylinder Test tubes
Fresh 3% H2O2
forceps
Water pan
Test tube rack Catalase solution
Thermometer
Filter Paper
Paper punches
Catalase
Reaction chambers (Drosophila vials with 1- hole stoppers
Stop watch Ice
Also needed to prep lab: liver, cheesecloth, blender
Procedure:
1. Prepare a table in your data book similar to Table 1.
2. Obtain a small amount of stock catalase solution in a 50-ml beaker
3. Obtain a reaction chamber and a number of filter-paper disks.
4. Place four catalase-soaked filter paper disks high on one interior sidewall of the reaction chamber. (They will stick to the sidewall.) Prepare a disk for use in the reaction chamber by holding it by its edge with a pair of forceps and dipping it into the stock catalase solution for a few seconds. Drain the disk against the sidewall of the beaker before you transfer it to the reaction chamber. CAUTION: Forceps are sharp. Handle with care.
5.Stand the reaction chamber upright and carefully add 10 mL of 3% hydrogen peroxide solution. Do not allow the peroxide to touch the filter paper disks.
6. Tightly stopper the chamber.
7. Fill a pan almost full with water.
8.Lay the 50-mL graduated cylinder on its side in the pan so that it fills with water completely. If any air bubbles are present, carefully work these out by tilting the cylinder slightly while keeping it underwater. Turn the cylinder upside down into an upright position keeping its mouth underwater at all times.
9.Carefully place the reaction chamber and its contents on its side in the pan of water. Make certain that the side with the disks faces upward.
10. Move the graduated cylinder into a position so that its mouth comes to lie directly over the tip of the dropping pipet. One member of the team should hold it in this position for the duration of the experiment.
11. Rotate the reaction chamber 180o on its side so that the hydrogen peroxide solution comes into contact with the catalase-soaked disks.
12. Measure the gas levels in the graduated cylinder at 30-second intervals for 10-now 5 minutes. Record the levels in your data table.
Here are our results:
And here is the graph:
After we finished the experiment, we concluded the following results: The first thirty seconds, there is a big increase of rate of reaction, after which it slowed down. After 5 minutes, it sometimes slowed down the reaction, but the differences were very minute. Therefore, i believe that if we had an hour more so we could have gone with the whole experiment instead of cutting it in half, there would have been much more significant differences. The greater amount of dots, the faster the rate of the reaction, however, three and 4 dots were about the same rate, so we would like to try having more dots to confirm this limit(maybe).
Analysis:
We have drawn the graph in our results.
As the time progresses, the rate of the enzymatic reaction goes down a little bit. Although the differences are subtle, the graph of 4 dots showed that in the first thirty seconds it bursts at 2.5 ml of oxygen but then it only went one more milliliter in the next, and then it started being stagnant at the rate of about 0.5 ml per second. Because of this, we should test it with ten minutes to detect the later changes toward the end. For all we know, it could stop by ten minutes.
2. (Graph is above)
The enzyme activity tends to be more as concentration increases which makes the reaction faster. My graph shows that as we increased the number of dots in the reaction, the rate of the reaction and amount of oxygen produced increased. For example, with 1 dot it ends at 2.7 ml while 2 dots ends at 6.4 ml. Three and four dots both ended at 7 ml though, so we should test more to see if there is a maximum amount of enzymes that can be active at one time. We should try more than four dots and also more time because at the end, 3 dots slowed down a little.
3,4,5. We did not do part b and c


No comments:
Post a Comment