Sunday, May 10, 2015

Ecology of the Bellarmine Campus

Producer:

Rose

Rusa

This is a rose in front of Liccardo. Receives a lot of sunlight.

Primary consumer:

Snail

Cornu Aspersum

These little pests eat leaves but we don't have any snail poison...

Secondary consumer:

Pigeon:

Columba livia

Tertiary consumers:

House cat

Felis Catus

These furry cute things love to chase around birds and this one apparently likes to sleep on cars.

Decomposed:

Earthworm

Lumbricus Terrestris

These little things were hard to find, even in the rain. Do our lawns use some heavy pesticides?

Herbivore
House sparrow
Passer domesticus
These birds eat seeds and are found sometimes flying around the bcp campus.

Omnivore:

Vince/ human

Vincius humanoidus/ Homo sapiens 

This guy is a good friend of mine and he is a omnivore. Humans are naturally omnivores and Bellarmine students are all over the entire campus.

Carnivores:

Crow

Corvus Brachyrhynchos

These are scavengers and they eat meat that's rotten. Pretty bad habit but only way they can survive.

Threatened species

Horsetail

Equisetum

These are planted near sobrato. Many people fall on them, causing damage.

Endangered species

Ginkgo

Ginkgo Biloba

Near Mr. Wong's classroom. Very tall, these produce a foul when paired.

Invasive/non native species

Blue eyes fuchsia

Fuchsia magnallenica

These are found near the statue of Mary. Very pretty, it is only found in Texas, Washington, a ca state park.

Pollution source:
Car
Scientific name: automobilus Carus
These are what we use to drive to school every day. Causes lots of pollution.

Free response questions:

1. Ecology is the science of physical, chemical, and biological interrelations within the environment. For example, in our Bellarmine campus, it would be the relationship of the organisms that affect each other greatly and determine the transfer of energy. It would have the producer, primary consumer, secondary consumer, tertiary consumer, and decomposers. Environmental science deals more with how we humans interact with the local environment. We do participate in the food chain of the Bellarmine campus, however, we impact the environment of the Bellarmine campus greatly. For example, the cars that we drive add to the pollution, we plant flowers that are primary consumers, however, we don’t eat them. We keep cats and dogs, tertiary consumers, as pets which could affect the ecology of the campus. Therefore, the relations of humans and ecology is considered environmental science.


2. Let’s take the community of the trees in Bellarmine. On those trees, there takes place a massive number of interactions between species.The tree itself is a producer, as it requires the abiotic factors of water, sunlight, soil, temperature, and oxygen. On the tree, or within the tree, there resides a huge number of bugs, primary consumers. These bugs are consumed by birds, secondary consumers, and, although I’ve never seen a cat on that tree, there might be a cat that eat birds. There are also squirrels who live on the trees for shelter and food.Decomposers are found at the bottom of trees, and nitrogen fixing bacteria live on the root of the tree, as they produce nitrogen while the tree supplies them with nutrients from photosynthesis.


3. Here is a food chain of the organisms I that have found on campus:

It goes from the producer(rose/rosa) to the primary consumer(garden snail/cornu aspersum) to the secondary consumer(crow/corvus brachyrhynchos) to the tertiary consumer(domestic cat/felis catus). The dead organisms will be decomposed by the decomposer(earthworm/lumbricus terrestris) and the nutrients will go back to the producer. In a food web, there are many organisms of the same level. In an ecological pyramid, the energy gets less and less as it moves up in the food chain:


4. Endangered species: Ginkgo Biloba. This species is the only specie of living ginkgoes. It is only found in China, but are cultivated across the world. Ginkgo soup is very delicious, as one group in our class brought in some for their Phylum Presentation. Usually, ginkgo males and females are not planted in the same place because of the strong odor when they are together. Threatened species: horsetail. Horsetail is a species of Equisetum, which is the olnly living genus of the class. Therefore, horsetail is a threatened species. Non-native species: blue eyes fuchsia. Grows in Seattle, Houston, Salt Lake City, and Amesti.


5. Pollution is the contamination of the biological ecosystem that can damage the environment. In our campus, there are many cars, which introduce pollutants into our ecosystem by burning up fuel and letting it out through the exhaust. The train also contaminates our campus.Litter is also a source of pollution, however, it is usually cleaned up because we are very careful and also because of people who have afternoon JUGs which clean up.

Tuesday, March 24, 2015

Junk DNA???

    There is no junk DNA, only junk DNA users (Quote from Douluo Dalu but replaced Spirit with DNA). First of all, we’re completely made of DNA. To refer to DNA as junk is to refer to ourselves as junk. It’s like saying “I’m stupid I’m stupid I’m junk I’m junk” a thousand times over. According to Medical News, “In genetics, the term junk DNA refers to regions of DNA that are noncoding. DNA contains instructions (coding) that are used to create proteins in the cell. However, the amount of DNA contained inside each cell is vast and not all of the genetic sequences present within a DNA molecule actually code for a protein.” Junk DNA refers to noncoding DNA, but even those have a purpose. If it didn’t it wouldn’t be there by now! Secondly, I believe that here isn’t just no purpose to it. If we remember from class, each time DNA replicates, it gets shorter every time. Studies show that junk DNA is over 90% of DNA. Each time the DNA strand gets shorter, it has a 90% of erasing “Junk DNA”. Now let’s just say we delete all that “junk DNA” and get right to the good stuff. It deletes the coding DNA every. single. time. Not so eager now to get rid of all that “junk DNA” now, are you disbelievers? But some may claim, “it’s still junk! It’’s just a sacrificial pawn!” But even sacrificial pawns have a purpose. Junk is defined as “old or discarded articles that are considered useless or of little value.” We’re not willing to discard it. Then why would it be junk? Junk DNA serves a purpose. Therefore, I claim that no DNA is junk!

Tuesday, February 24, 2015

Counting Corn

In the 1600’s, people had no video games, so instead they had various activities such as husking bees, where if you get a red ear of corn, something good happens to you. But why only red years of corn? Mainly because there were not that much. Because red was the recessive gene. But since nobody knew that because Mendel was born in 1822 so he didn’t exist yet to publish his genetics theory. Now forward this 400 years to where we are now, and instead of having yellow dominant ears, we are counting purple dominant yellow recessive ears of corn for biology class(for points and our grade, not for kisses). We want to see the ears of corn and determine if the ears of corn are a good fit for Mendel’s theory or not. So we first counted the phenotypes of the kernels on five rows of a Monohybrid Cross, which should be a 3:1 ration for purple to yellow and the kernels should be all smooth.. Down below I have our diagram and picture:


Next we took a Test cross. Our expected was equal number for all types. Here is our diagram and picture:


Then we put our data into a chi square:


It has a 20-50% chance of the difference caused by chance, so therefore, it’s a good fit. So then our hypothesis of it being a 1:1:1:1 ratio is a good hypothesis and should not be tossed away. A good fit means how well the model(the corn) fits a set of observations. A poor fit is when you have to reconsider if there is a faulty approach and the hypothesis might be incorrect. A data might have poor chi square fit when Genes are linked or on the same chromosome, dramatically increasing the chance of a phenotype appearing. Another is when there is faulty data or just plain really really bad luck.

Now we have a problem set to finish.


1. Problem: A large ear of corn has a total of 433 grains, including 271 Purple & starchy, 73 Purple & sweet, 63 Yellow & starchy, and 26 Yellow & sweet.

Your Tentative Hypothesis: This ear of corn was produced by a dihybrid cross

(PpSs x PpSs) involving two pairs of heterozygous genes resulting in a theoretical (expected) ratio of 9:3:3:1.

Objective: Test your hypothesis using chi square and probability values.

The total number of kernels is 840. So the expected would be:

Purple and Smooth 9/16 * 433 = 243.6

Purple and Wrinkled 3/16 * 433 = 81.2

Yellow and Smooth 3/16 * 433 = 81.2

Yellow and Wrinkled 1/16 * 433 = 27.1

so after calculating that out would be:

3.08 + .82 + 4.07 + .04 = 8.01. According to the chi square, this is a bad fit.


2. Problem: In a certain reptile, eyes can be either black or yellow. Two black eyed lizards are crossed, and the result is 72 black eyed lizards, and 28 yellow-eyed lizards.

Your Tentative Hypothesis: The black eyed parents were Bb x Bb.

Objective: Test your hypothesis using chi square analysis. In this set, because only two values (traits) are examined, the degrees of freedom (df) is 1. SHOW ALL WORK!

If we draw a Punnet Square Bb and Bb, we should get a ratio of 3:1.

The total is 100, so we use that to calculate:

Black eyes should be 75 but is 72

Yellow eyes should be 25 but is 28

Calculating that out I get of chi value of .12+.36=.48 which is a good fit.


3. Problem: A sample of mice (all from the same parents) shows

58 Black hair, black eyes 16 Black hair, red eyes

19 White hair, black eyes 7 White hair, red eyes

Your tentative hypothesis: (what are the parents?)

Since the result is about 9:3:3:1, this is probably a dihybrid cross, making its parents HhEe and HhEe. The total offspring is 100, so the expected is:

9/16 of 100 = 56.25

3/16 of 100 = 18.75

3/16 of 100 = 18.76

1/16 of 100 = 6.25

I calculated this out to get:

.05 + .40 + .003 + .09 = .54

On the chi square, this is a good fit.

Sunday, February 1, 2015

Meiosis

    Why meiosis? Asking that question is like asking, “who am I?” Meiosis creates our identity. Many say it’s to pass on our genes. However, that is not always the case as just recreating the same genes would let us be infected by invading species faster. The function of meiosis is to both pass on our genes and give genetic diversity. Genetic diversity is a very powerful tool. WIthout it, a single invasive species can desecrate the whole population. Just like how Jedi and Sith in Star Wars are a lot more powerful than the simple clones and droids, which number by the millions and can be destroyed by a single one of the former, genetic diversity in humans lead to higher survivability, at the cost of less offspring.

    In this lab, we will be making a stop motion video of meiosis and I will be doing some research on meiosis and answer the questions.

    In meiosis, “crossing over” and “independent assortment” promote genetic variation. In crossing over, chromosomes swap their DNA in order for cells to inherit different traits from different parents. This occurs in prophase 1. In anaphase I and II, independent assortment causes different chromatids to get pulled to different sides of the cell randomly. This process is entirely random so there are 4 ways to assort in anaphase 1, and 4 ways in anaphase 2, making it 4*4 = 16 ways to independently assort the chromatids.

    Non-disjunction is when a problem occurs in meiosis and the chromosomes do not separate, causing one of the cells to have twice the amount and one of the cells to have none.This can occur in meiosis 1 and also in meiosis 2. Non-disjunction occurs because of a failure of a checkpoint. To be exact, the spindle checkpoint. This checkpoint monitors the correct formation of the spindle fibers, so if this checkpoint fails to work correctly, the spindle fibers do not work on one end, making the chromosomes get pulled all to the other side. A failure in cohesin(the glue tying the two chromatids together) would also cause non-disjunction, such as if it did not un-stick, one of the spindle fibers have to break, causing the non-disjunction.

    Pandas have 42 chromosomes. They are considered to have the same ancestor as bears, but normal bears have 74 chromosomes. Why is that? This is because the panda’s chromosome is very similar to two linked chromosomes of a bear. From this, we can deduce that the deviation in the species is because of non-disjunction, when the chromosomes do not split apart during meiosis. This can explain why the panda’s chromosome has two linked chromosomes and why the panda and the bear share a common ancestor. The panda is just a mutation(I apologize to all the pandas in the world).

    This lesson could be improved by showing two sides with egg cell and sperm cell production, and then showing the two cells combining with fertilization. And the zygote that appears afterward.

    Here is the link: https://m.youtube.com/watch?v=ipxyacE5Bso

Monday, January 19, 2015

Cancer

In this report, we interviewed a cancer patient, asked some questions, and researched the topic on a specific cancer.


The woman that I interviewed, namely, my grandmother, had breast cancer and she was diagnosed in September 31, 2000. At that time she was 63. There were no symptoms other than changes in shape like dents in the skin, etc. Her immediate response was the question, “Why is it me? How did I get it?” and she felt very sad and worried. She underwent chemotherapy, and then she had a surgery to remove the tumors. She did know what it specifically targeted, and so the chemotherapy was to reduce the size of the tumor and since it was inflamed, so it was also to help reduce the inflammation. Undergoing treatment, she did not like to talk, and her favorite foods did not seem appealing anymore. Everyone started taking care of her even more, and she did not have the energy to talk, so communication between family and friends went down dramatically. Her perspective of life changed as she began to recognize how frail life is, and how much we have to pay for the price of a life. She said that everything we know about cancer is correct and that it is a very dangerous and painful process. She offered a piece of advice. She told me to not overwhelm myself with work and not to sacrifice my health even if it is to care for the people that I know.

Note: These are not the exact words, as she can only speak in Chinese so I had to translate it into this report.


Research Questions:

  1. Breast cancer is a malignant tumor, which means that it starts out occurring in the breast cells but can spread to other parts of the body though metastasis. Therefore, it is possible for all the tissues and organs to be affected, but the starting point is the most likely.

  2. There are two genes that either help speed up cell division and slow down cell division. The type that speeds it up is called oncogenes while the ones that slow them down have a very appropriate name, tumor suppressors. Because the way of replicating DNA is  not always perfect, sometimes there are mutations that can make the oncogenes activate and cause tumors, or there can be mutations that can turn off the tumor suppressor genes, thereby causing more tumors/cancers. Sometimes, the mutations can be inherited, and so it doesn’t suppress abnormal growth, making it easier for breast cancer cells to develop. This theory is the general cancer cell theory. Specifically for breast cancer, there is the female hormone estrogen, which makes the breast cells divide faster, therefore making that those tissues more prone to tumors and cancer.

  3. Cell cycle is the process of the cells dividing, although it may also be the process of it just staying in G1 phase. The cells have to pass various checkpoints to go into the next phase. Cyclins help regulate the cell cycle so that cancers do not occur. However, mutations cause the cyclins at the checkpoints to not bother with the damaged cells, and moving it to the next stage, causing cancer.

  4. There are two types of treatments: local and systemic therapy. Local therapy is removing the cancer cells at that specific location, such as through surgery, where they directly cut out the tumor, and radiation therapy, where they target the cancer cells with radiation to destroy it along with the blood vessels that feed the cancer. Systemic therapy is a type which can affect cancer cells everywhere on the body. It is usually injected into the bloodstream or fed to the patient. Some of these are chemotherapy, hormone therapy, and targeted therapy. Even after the removal of the tumor, some cancer cells may have broken off prior to the treatment, which can cause tumors later. To prevent this, doctors usually use neoadjuvant therapy before the surgery, which will shrink the tumor and make the chances of another tumor appearing smaller. Adjuvant therapy is sometimes used after the surgery to kill the leftover hidden cancer cells.

  5. In order to prevent breast cancer, people need to limit the alcohol they drink, do not smoke and stay away from secondhand smoke, prevent obesity, stay physically active, avoid exposure to radiation(yes, radiation can kill cancer cells, but it can also cause more cancer cells in the process), and do not do hormone therapy for a long time because it may cause it to come back.

  6. 1 in 8 women develops breast cancer in the course of her lifetime, although for men it’s only 1 in every thousand. Breast cancer rates have been reduced because people are using less hormone replacement therapy after it was suspected of leading to breast cancer. 30% of cancer in women are breast cancer, just under skin cancer. In 2014, there are 2.8 million women who have had breast cancer before, are being treated, or are diagnosed with it, and each year, 40,000 people die from breast cancer.

  7. Breast cancer varies among populations, with the highest in the U.S. and lowest in Asian countries. It also varies with race within the U.S. population. According to Medscape, “Breast cancer incidence among Chinese-American and Japanese-American women from 1973-1986 was about 50% lower for those born in Asia and about 25% lower for those born in the United States compared to white women born in the United States.”And also, it turns out that the probability that someone gets breast cancer grows until they are fifty, at which it remains the same. Since 1950, the number of women that get breast cancer are growing, nearly doubling in some urban countries such as China, as well as increasing in Western countries such as the U.S. due to growing affluence in the countries.

Tuesday, January 13, 2015

Mitosis

    Cells split. We grow. It splits again. We grow again. It splits again. Then we grow even more. This repeating process of cellular division is one of our cell’s basic functions of life. However, to split and divide something like a cell, you need to accurately replicate all the information inside. We call this process cellular division, but that name doesn’t quite live up to the process. If you split a book in half, you would only get half the knowledge, which would actually really suck because if you got half the biology textbook, you would fail Mr. Wong’s final exam. Therefore, our cell has mitosis, which nuclear replication more accurately describes than cell division.

    In this experiment, we are looking at the stages of cellular division/nuclear replication aka mitosis. We used whitefish blastula and onion root tip cell to observe this process. Why? Because if we used another cell, our lab time would be used up before we even got to observe and take all the pictures. Then I wouldn’t be able to write this report. Whitefish blastula are the embryo of the whitefish as it starts developing. This causes a lot of mitosis activity as babies grow much faster than we do. Or else everyone in this class would be over 30 feet tall by now, comparable to the BFG, and adults would be suffering from the many disadvantages of being too tall. Onion root tip cells have a lot of mitosis activity mainly because the root is the part of the plant that grows the most. Why the onion root cells though? Mainly because it is easier to see. That’s all.

    For this part of the experiment, I took pictures of the different stages and posted them on the worksheet below.


In this next part of the mitosis experiment, we are going to see how often the cells stay in each state. I believe that the most common state is going to be interphase, because otherwise we would grow too fast, as said before. With the help of Mr. Wong and the advanced microscope in class, I was able to take 3 excellent field of view pictures of the onion cell. Here they are:


    I have also filled in the chart of how often they occur. Please excuse my sorry counting skills because this situation does not permit me to use permutations or combinations.


    However, the chart is not accurate for all of the cell because we only took pictures of the parts that are actively dividing. Because if we took pictures of the non active sites, that would be very boring and would be a very sad excuse for this experiment. Imagine all of the cells in interphase and prophase. Because of this, our results would have been dramatically different as there would be mostly interphase.

    It takes a lot of time for prophase and a very short time for metaphase, anaphase, and telophase. Interphase takes up the most time though, because we are staying the same most of the time without changing. It takes time for the cell to grow and split. It’s like going to read another book before you finished this one. Prophase does take up a lot of time though, which is very interesting.
   My conclusion was supported, as it took a lot of time for interphase, even at the active sites. Mitosis is the basic function of life. However, the life of cells must end sometime, and so does this report. So regrettably, if this was a cell, about now it would go through apoptosis.

Thursday, November 20, 2014

Catalase enzyme

The purpose of this lab was to measure the rate of the reaction from the catalase enzyme and hydrogen peroxide from the number of enzymes we used to speed up the reaction. Because enzymes are things that speed up reactions, we test the use of it by using hydrogen peroxide. The formula is 2*H2O2-> 2h2O +O2. This means changing hydrogen peroxide to water and oxygen. So we're testing how much oxygen gets released in the limited amount of time.

We hypothesize that the more enzymes we put into the solution the faster the reaction will be and the more time passes by, the reaction rate will slow down, so in the beginning it will react fastest and after it will slow.

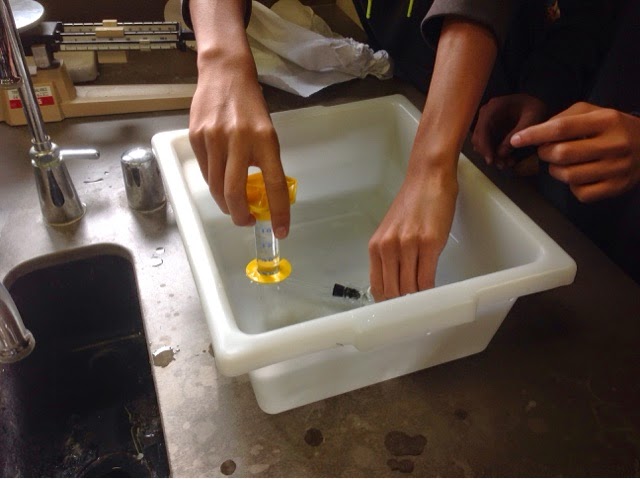
Here is our procedure and materials.

Materials: (per team of 2) 2 pairs safety goggles

2 lab aprons

50 mL beaker

10 mL and 50 mL graduated cylinder Test tubes

Fresh 3% H2O2

forceps                   

Water pan

Test tube rack Catalase solution               

Thermometer

Filter Paper

Paper punches

Catalase

Reaction chambers (Drosophila vials with 1- hole stoppers                   

Stop watch Ice                   

Also needed to prep lab: liver, cheesecloth, blender


Procedure:

1. Prepare a table in your data book similar to Table 1.

2. Obtain a small amount of stock catalase solution in a 50-ml beaker


3. Obtain a reaction chamber and a number of filter-paper disks.

4. Place four catalase-soaked filter paper disks high on one interior sidewall of the reaction chamber. (They will stick to the sidewall.) Prepare a disk for use in the reaction chamber by holding it by its edge with a pair of forceps and dipping it into the stock catalase solution for a few seconds. Drain the disk against the sidewall of the beaker before you transfer it to the reaction chamber. CAUTION: Forceps are sharp. Handle with care.


5.Stand the reaction chamber upright and carefully add 10 mL of 3% hydrogen peroxide solution. Do not allow the peroxide to touch the filter paper disks.

6. Tightly stopper the chamber.

7. Fill a pan almost full with water.


8.Lay the 50-mL graduated cylinder on its side in the pan so that it fills with water completely. If any air bubbles are present, carefully work these out by tilting the cylinder slightly while keeping it underwater. Turn the cylinder upside down into an upright position keeping its mouth underwater at all times.

9.Carefully place the reaction chamber and its contents on its side in the pan of water. Make certain that the side with the disks faces upward.                           

10. Move the graduated cylinder into a position so that its mouth comes to lie directly over the tip of the dropping pipet. One member of the team should hold it in this position for the duration of the experiment.                   

11. Rotate the reaction chamber 180o on its side so that the hydrogen peroxide solution comes into contact with the catalase-soaked disks.                   


12. Measure the gas levels in the graduated cylinder at 30-second intervals for 10-now 5 minutes. Record the levels in your data table.

Here are our results:


And here is the graph:

After we finished the experiment, we concluded the following results: The first thirty seconds, there is a big increase of rate of reaction, after which it slowed down. After 5 minutes, it sometimes slowed down the reaction, but the differences were very minute. Therefore, i believe that if we had an hour more so we could have gone with the whole experiment instead of cutting it in half, there would have been much more significant differences. The greater amount of dots, the faster the rate of the reaction, however, three and 4 dots were about the same rate, so we would like to try having more dots to confirm this limit(maybe).

Analysis:

  1. We have drawn the graph in our results.

As the time progresses, the rate of the enzymatic reaction goes down a little bit. Although the differences are subtle, the graph of 4 dots showed that in the first thirty seconds it bursts at 2.5 ml of oxygen but then it only went one more milliliter in the next, and then it started being stagnant at the rate of about 0.5 ml per second. Because of this, we should test it with ten minutes to detect the later changes toward the end. For all we know, it could stop by ten minutes.

2. (Graph is above)

The enzyme activity tends to be more as concentration increases which makes the reaction faster. My graph shows that as we increased the number of dots in the reaction, the rate of the reaction and amount of oxygen produced increased. For example, with 1 dot it ends at 2.7 ml while 2 dots ends at 6.4 ml. Three and four dots both ended at 7 ml though, so we should test more to see if there is a maximum amount of enzymes that can be active at one time. We should try more than four dots and also more time because at the end, 3 dots slowed down a little.

3,4,5. We did not do part b and c